Make the Right Choice for Your Profits
Traditional vending machines are holding your business back. 365 Retail Markets offers smarter solutions designed specifically to overcome vending's limitations, boost your profits, reduce shrink, and deliver an exceptional customer experience.
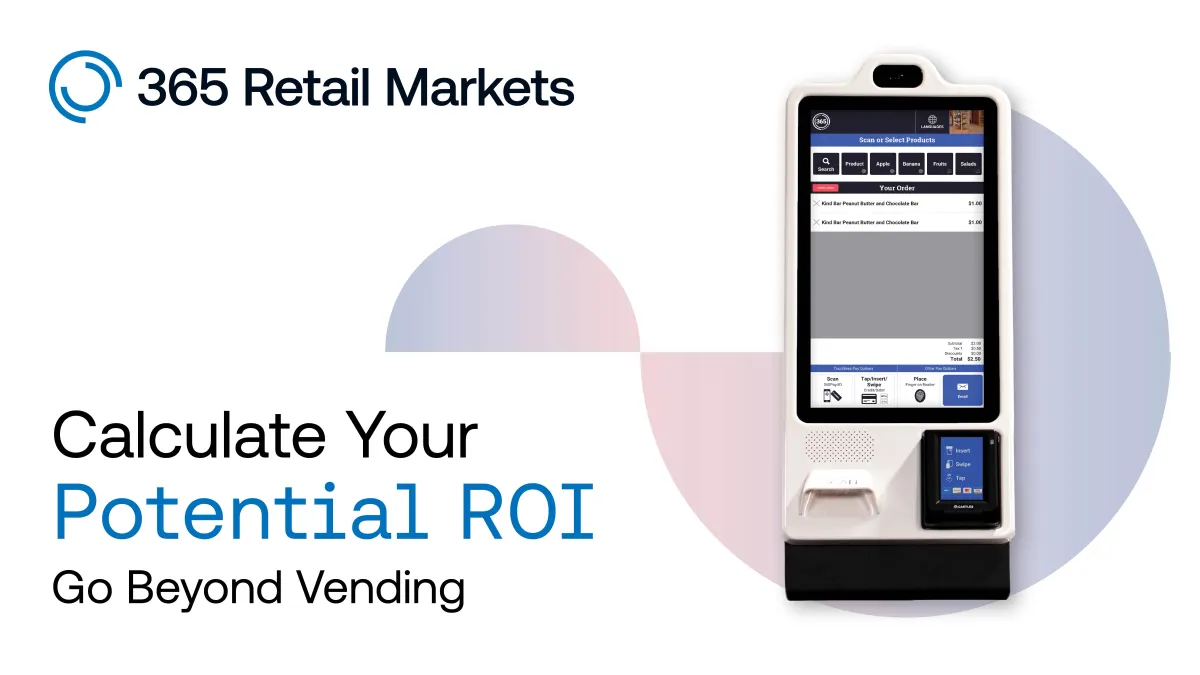
See exactly how much more you could earn with our easy-to-use ROI Calculator and start making strategic decisions to grow your business today.
Why Upgrade from Traditional Vending?
Traditional vending machines operate on single-item, low-ticket transactions—limiting your revenue per sale. PicoCooler Vision, Stockwell, and MM6 Mini revolutionize your profitability by encouraging customers to shop, not just buy.
Operators who make the switch report:
The calculator has three built-in formulas that will produce three different results:
- Your estimated total profits if you were to stay with vending.
- The additional profits generated by replacing vending with the technology you are interested in.
- Your total profits if you were to switch from vending to the technology you are interested in.
* Please note: while the calculator is best suited at taking your overall annual vending revenue, you can also input annual vending revenue at a specific location. However, the revenue number needs to be higher than $10,000 for the formula to work properly.
Feel free to experiment with the calculator and see what potential growth you could see with different solutions from 365 Retail Markets. Like what you see? Enter your email address in the form below to get in touch with our team.
If you wanted to know more about how the formulas were created, we have included a breakdown of each one below at your convenience.
1) Expected Total Profits with Vending
(Your average annual vending revenue) – (Your average annual vending revenue * COGS at 40%)
2) Additional Profits by Desired Product
(Product Lift * expected total profits with vending)
3) Total Profits by Switching to Desired Product
((Additional Profits by Desired Product + Expected Total Profits with Vending) + (Your average annual vending revenue * .15) – (Market Subscriptions + Depreciation)
Partner with 365 and Grow Your Business
365 Retail Markets invests in innovation tailored specifically to help your business succeed. Our client-focused solutions such as PicoCooler Vision, Stockwell, and MM6 Mini are proven to boost profitability, enhance security, and deliver precise pricing advantages. We don't just provide technology; we offer a fully integrated ecosystem designed for your long-term success.
Take control of your growth. Complete the form now to connect with our expert team and start maximizing your business’s potential.


