Published • 21 Oct 2025
Running unattended retail is part art, part discipline — and all about understanding how small choices affect the bottom line. Every product you stock and every promotion you launch generates data. The challenge is turning that constant stream of information into practical, profitable decisions.
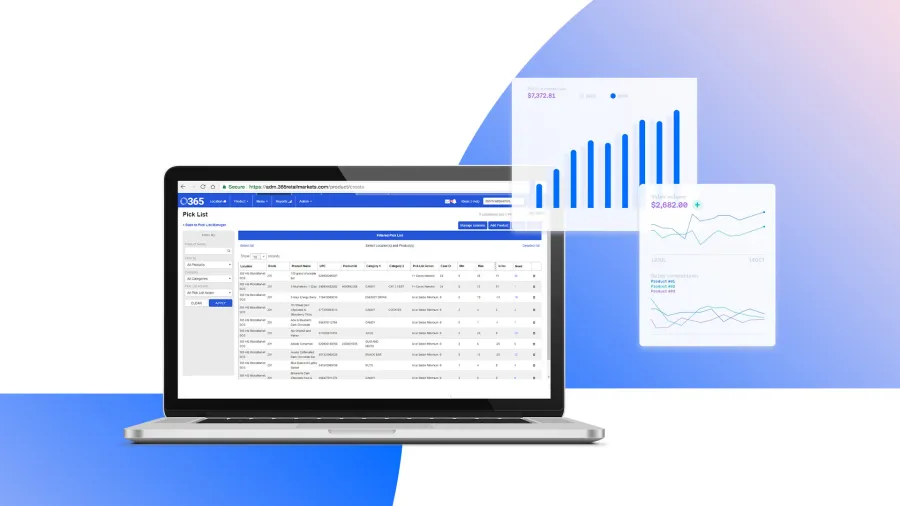
That's where ADM earns its place. ADM is a back-end software that powers the entire 365 ecosystem, bringing together every transaction, product, and inventory detail across your locations into one connected platform. It gives you a clear, real-time view of your business so you can make faster, smarter decisions with confidence.
More than a data collector, ADM makes information usable. It turns thousands of transactions into a clear picture of what's working, what isn't, and where your next opportunity lies.
The following reports illustrate how ADM creates measurable impact, whether you're managing a single market or leading a national operation.
1. Product Sales Report
The clearest picture of what's working.
Every retail business develops assumptions about its bestsellers. The Product Sales Report puts those assumptions to the test. It ranks every item by performance, giving you a precise view of which products generate the most revenue and which slow down turnover.
At a smaller scale, this report helps refine decisions that usually come from intuition. A café or single cooler owner can quickly see how product swaps affect sales and make evidence-based adjustments.
At a larger scale, the same report becomes the foundation for regional and seasonal planning. Companies compare performance across dozens of sites, identify patterns by time of day or geography, and negotiate better supplier terms with hard data behind them.
Understanding what sells is only the beginning. The next question is what to do with the products that don't.
2. Unsold Products Report
The cost of what doesn't move.
While the Product Sales Report celebrates what's performing, the Unsold Products Report exposes the quiet drag on your profit: inventory that takes up space and ties up capital.
For smaller businesses, this report is a quick way to free up shelf space for items that actually earn their keep. Even one or two poor performers can distort your product mix and slow overall sales.
For larger operations, it becomes a planning tool for product resets and assortment optimization. When you can see unsold inventory across multiple locations, it's easier to align purchasing with demand and reduce spoilage before it starts.
Managing what doesn't sell naturally leads to a more challenging question — how accurate are the counts behind those products?
3. Inventory Variance Report
Finding the gaps before they grow.
The Inventory Variance Report shows the difference between what the system says you have and what's actually on the shelf. That gap — even when small — can signal shrink, scanning errors, or breakdowns in process that quietly chip away at profit.
For smaller businesses, this report brings accountability without complexity. It highlights discrepancies in real time, making it easier to pinpoint where and when errors happen.
For larger operations, it functions as an operational audit. Patterns across multiple markets reveal whether issues are isolated or systemic, guiding training and process improvements.
Accurate inventory data strengthens more than control — it reinforces confidence. When your counts are right, your financial summaries finally reflect reality.
4. Financial Recap Report
Your business's pulse, at a glance.
The Financial Recap Report consolidates sales, costs, taxes, and spoilage into one snapshot. It's the high-level summary that shows whether decisions made at the product level are improving overall performance.
For smaller businesses, it's a practical checkpoint. Reviewing it weekly helps owners track whether pricing changes and inventory adjustments are improving margins or just shifting the problem.
For larger operations, the same report becomes a benchmarking tool. Leadership teams use it to identify outliers, set goals, and ensure every region runs with the same financial discipline.
Once you have a clear picture of sales and margins, the next opportunity is influence — how to shape customer behavior to lift performance further. ADM's Promotion Analysis Report bridges that gap.
5. Promotion Analysis Report
Connecting insight to action.
The Promotion Analysis Report brings measurement to marketing. It shows which offers drive real sales and which move the same dollars around.
For smaller businesses, it offers clarity about which promotions are worth repeating and which quietly cut into profit. A single data-backed decision — like limiting discounts to products that trigger larger baskets — can meaningfully improve outcomes.
For larger teams, it informs future campaigns at scale. Marketing and operations teams can measure how different promotions perform by region, customer type, or time period, closing the loop between creative strategy and financial results.
Promotions drive momentum, but availability sustains it. The Item Stockout Report ensures that the products your customers want are actually there when they reach for them.
6. Item Stockout Report
Keeping the shelves — and profits — full.
Every empty shelf represents a missed sale. The Item Stockout Report flags those gaps early, identifying products that sell out faster than they can be restocked.
At a smaller scale, it prevents frustration for regular customers who expect consistency. Knowing which products need tighter ordering cycles directly translates to steadier revenue.
At a larger scale, it helps logistics teams rebalance distribution. Seeing which items sell out across multiple markets prevents repeat shortages and helps forecast true demand.
Together, these reports do more than reveal performance — they build a management rhythm. Each one connects to the next, forming a cycle of visibility, adjustment, and improvement that turns everyday data into growth strategy.
Turning Reports into Results
ADM's greatest value isn't in how many reports it offers, but in how easily they translate into action. Whether you are refining a product lineup or managing hundreds of markets, the same data foundation consistently supports better decisions with confidence.
If you're already using ADM, start by running one of these reports this week and look for one actionable change.
If you're exploring what 365 can do, discover how ADM gives you the insights that make your retail business more efficient, more predictable, and more profitable.
ADM: Where data turns into better decisions.